WHAT IS SBGN
SPECIFICATIONS
SOFTWARE
EVENTS
FAQ
HOW TO CITE
ABOUT
CONTACT
Learning SBGN
Examples
Reference Cards
Published Maps
Symbol Highlights
Figure to SBGN
Competition
Development Wiki
Examples
File formats for downloading (where available):
- SBGN-ML: SBGN-ML 0.2 format exported from the VANTED/SBGN-ED editor, colours are not saved in this format
- SBGN-ED: GraphML file exported from the VANTED/SBGN-ED editor, colours and modified fonts are saved in this format
- PNG: Portable Network Graphic
- Newt: A link for opening SBGN-ML file in the Newt Editor
PD Level 1 examples
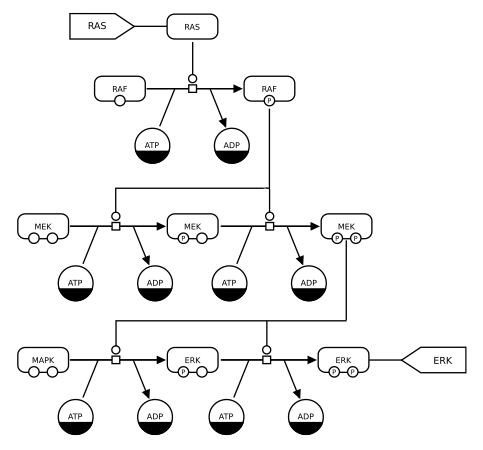
MAPK
This example of an SBGN Process Description uses two kinds of Entity Pool Nodes (that is, nodes representing biochemically-indistinguishable entities such as molecules). One kind of Entity Pool Node (whose glyph is a rounded rectangle) represents different macromolecules, and the other (whose glyph is a circle) represents pools of simple chemicals. Most macromolecule nodes in this map are also adorned with state variables representing phosphorylation states. This map uses one type of process node, the transition node, and one kind of connecting arc, catalysis. Finally, some entity pool nodes have dark bands along their bottoms; these are clone markers indicating that the same pool nodes appear multiple times in the diagram.
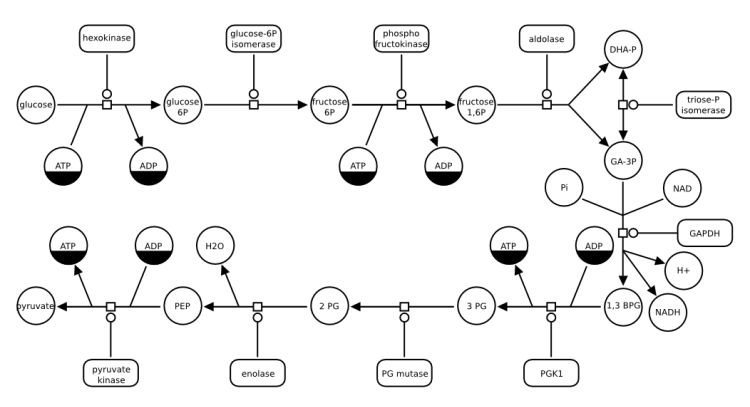
Glycolysis
This example illustrates how SBGN can be used to describe metabolic pathways. The following map represents glycolysis, the process that releases energy from the catabolism of glucose. In this example, macromolecules are only catalysts, and the other (whose glyph is a circle) are consumed or produced. Note that some carry clone markers, while others, present only once, do not need to.
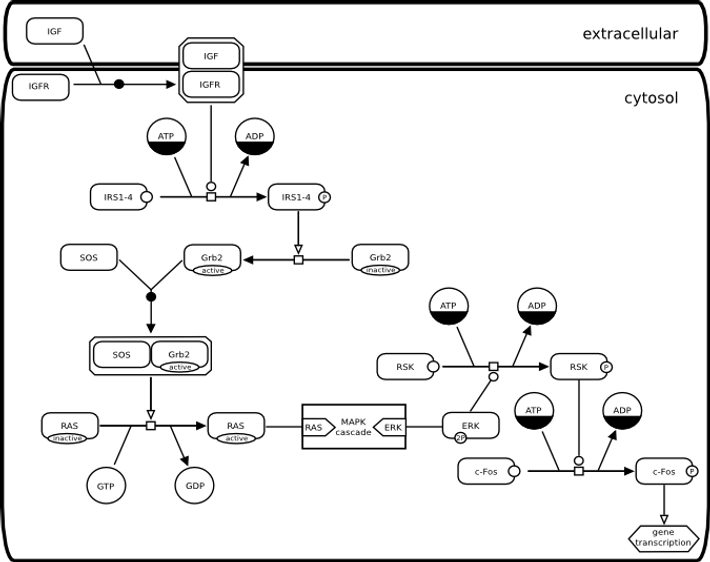
Insulin signalling
Next example presents an example of signalling pathway, that examplifies the use of the entity pool nodes observable, and state variable, the containers complex, compartment and submap, the process nodes association, and the connecting arcs stimulation. Note the complex IGF and IGF receptor, located on the boundary of the compartment. This position is only for user convenience. The complex has to belong to a given compartment in SBGN Process Diagram Level 1. This example also shows how details can be hidden by using a submap. The submap called MAPK cascade is shown in the first example above. Note the tags that permit to identify the same entity in the submap and the main map.
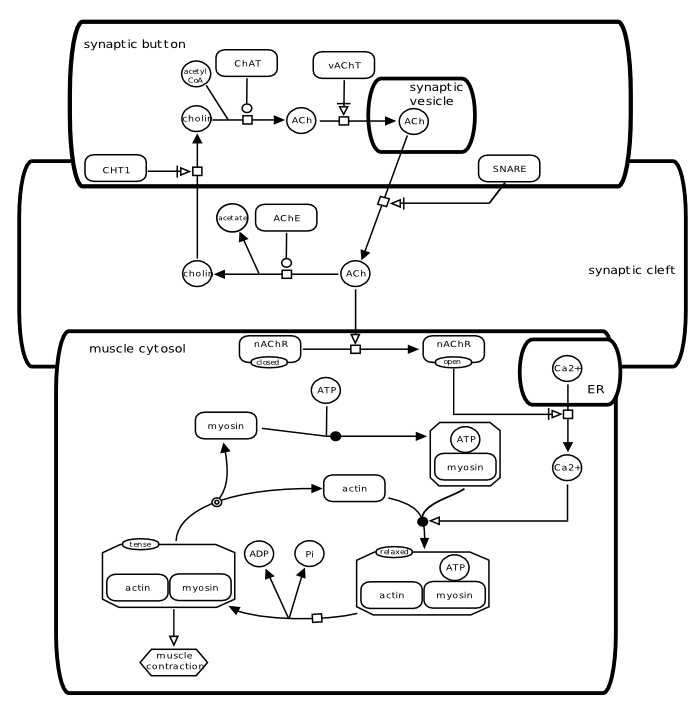
Neuro-muscular junction
This example introduces an SBGN Process Description that spans several compartments. Note that the compartment [synaptic vesicle] is not contained in the compartment [synaptic button] but overlaps it. The simple chemical [ACh] of the [synaptic vesicle] is not the same entity pool node than the [ACh] of the [synaptic button] and of [synaptic cleft]. The situation is similar with the compartments [ER] and [muscle cytosol]. The map exemplifies the use of the process nodes omitted and dissociation, and the connecting arc Necessary activation.
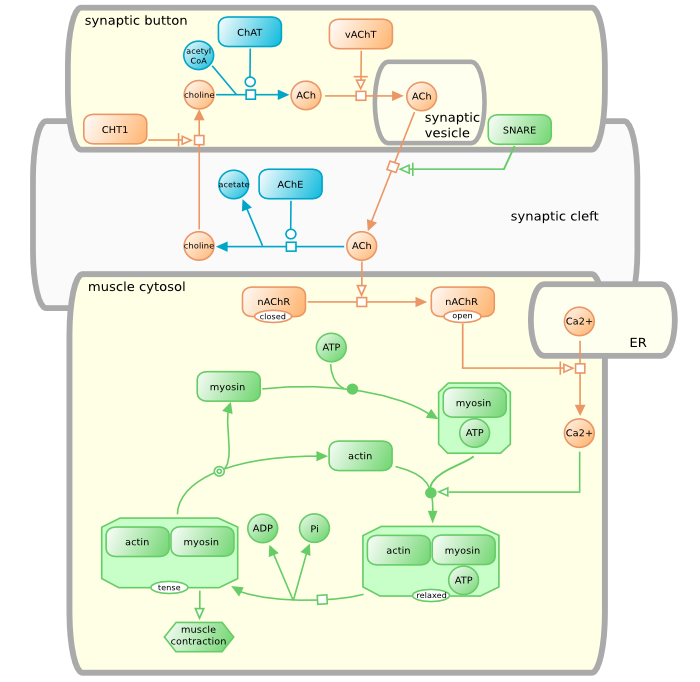
And the colorful version of that map as well:
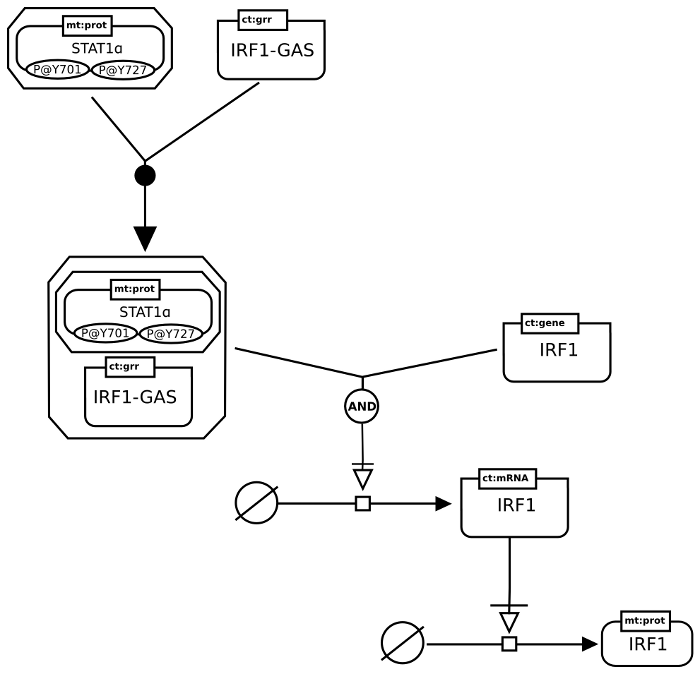
IFN regulation
This next example involves a gene regulatory network. It also shows the use of the Entity Pool Node source/sink and the logical operator glyph for and.
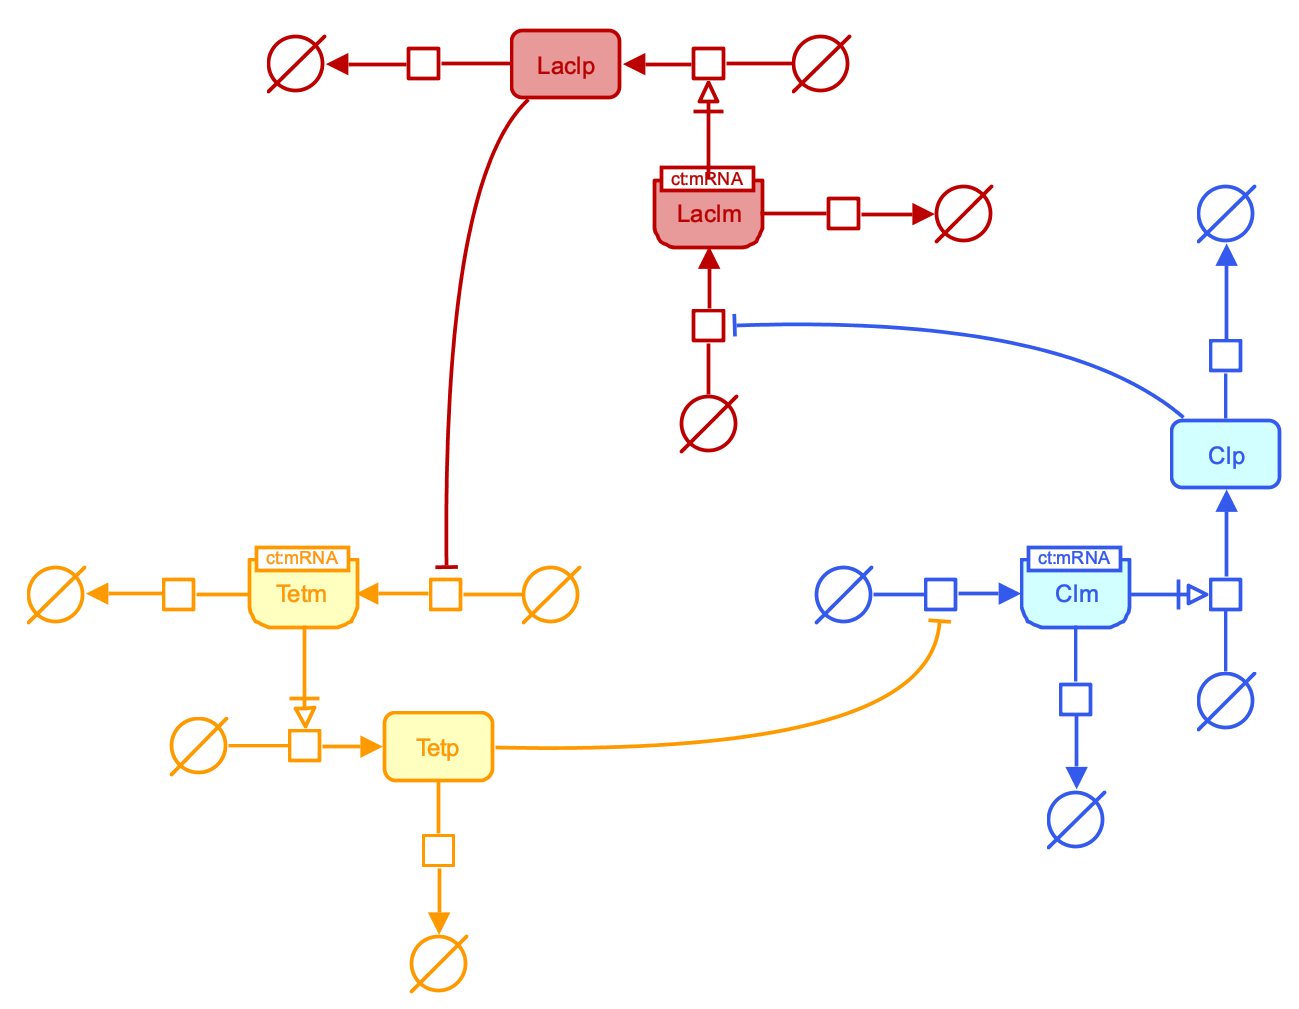
Repressilator (PD)
The repressilator is a circular system of three genes which products sequentially inhibit the expression of the next gene. Both the model and its in vitro realization were published by Michael Elowitz and Stanislas Leibler in 2000, in a publication that is seen as one of the milestones in the birh of Synthetic Biology.
Downloads: PNG SBGN-ED SBGN-ML Newt
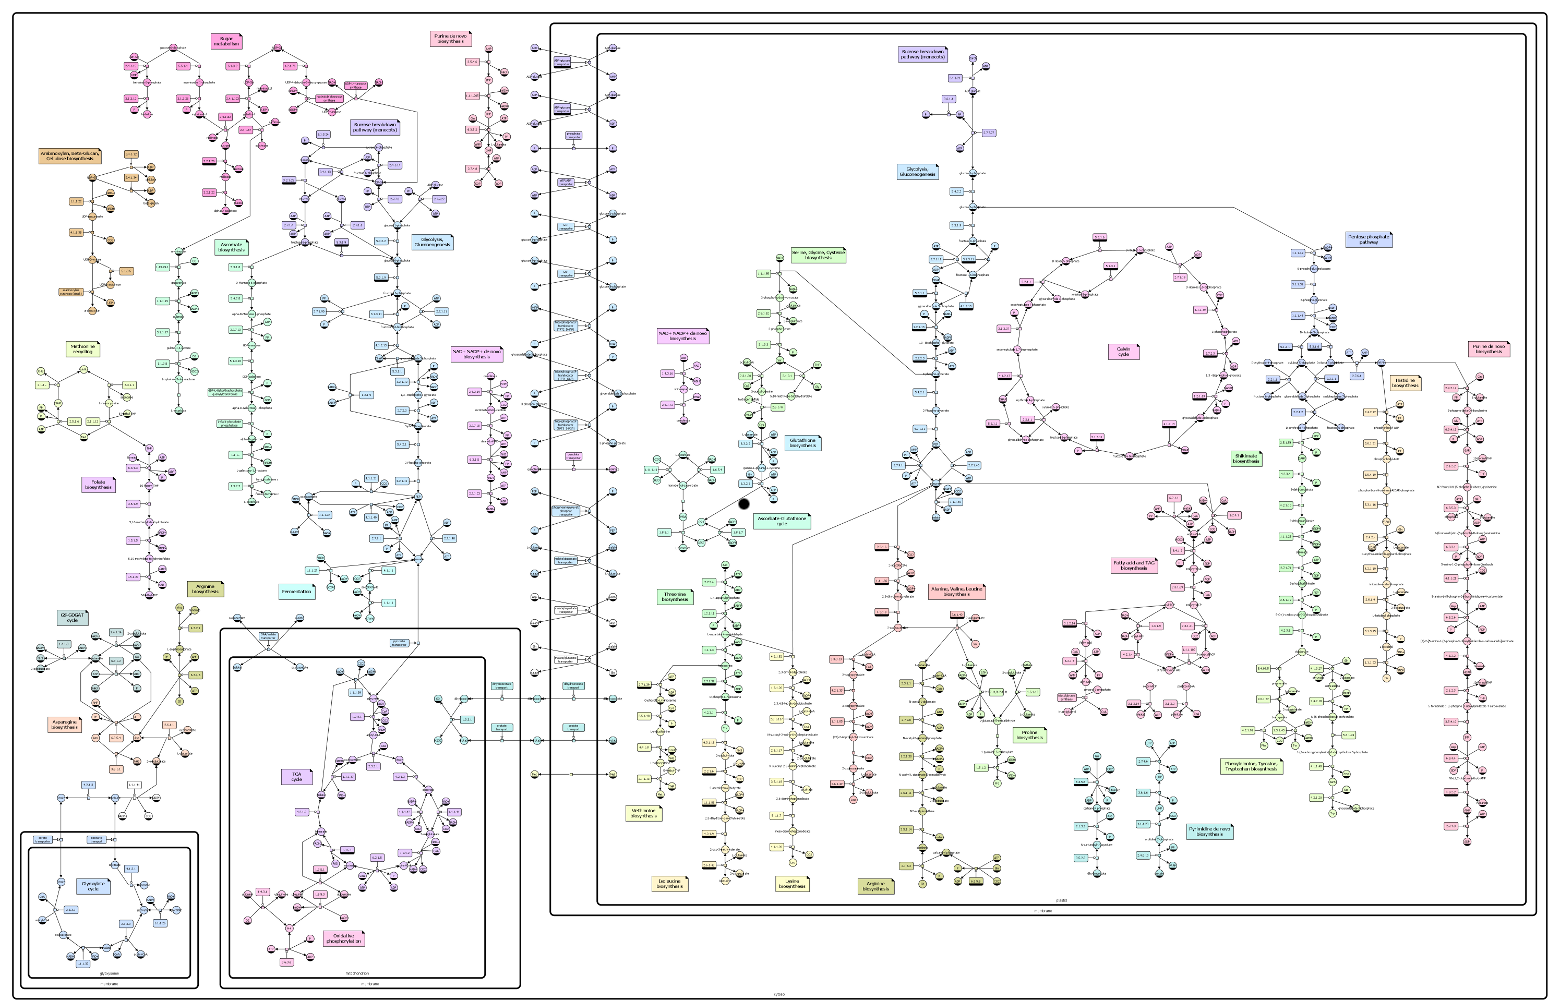
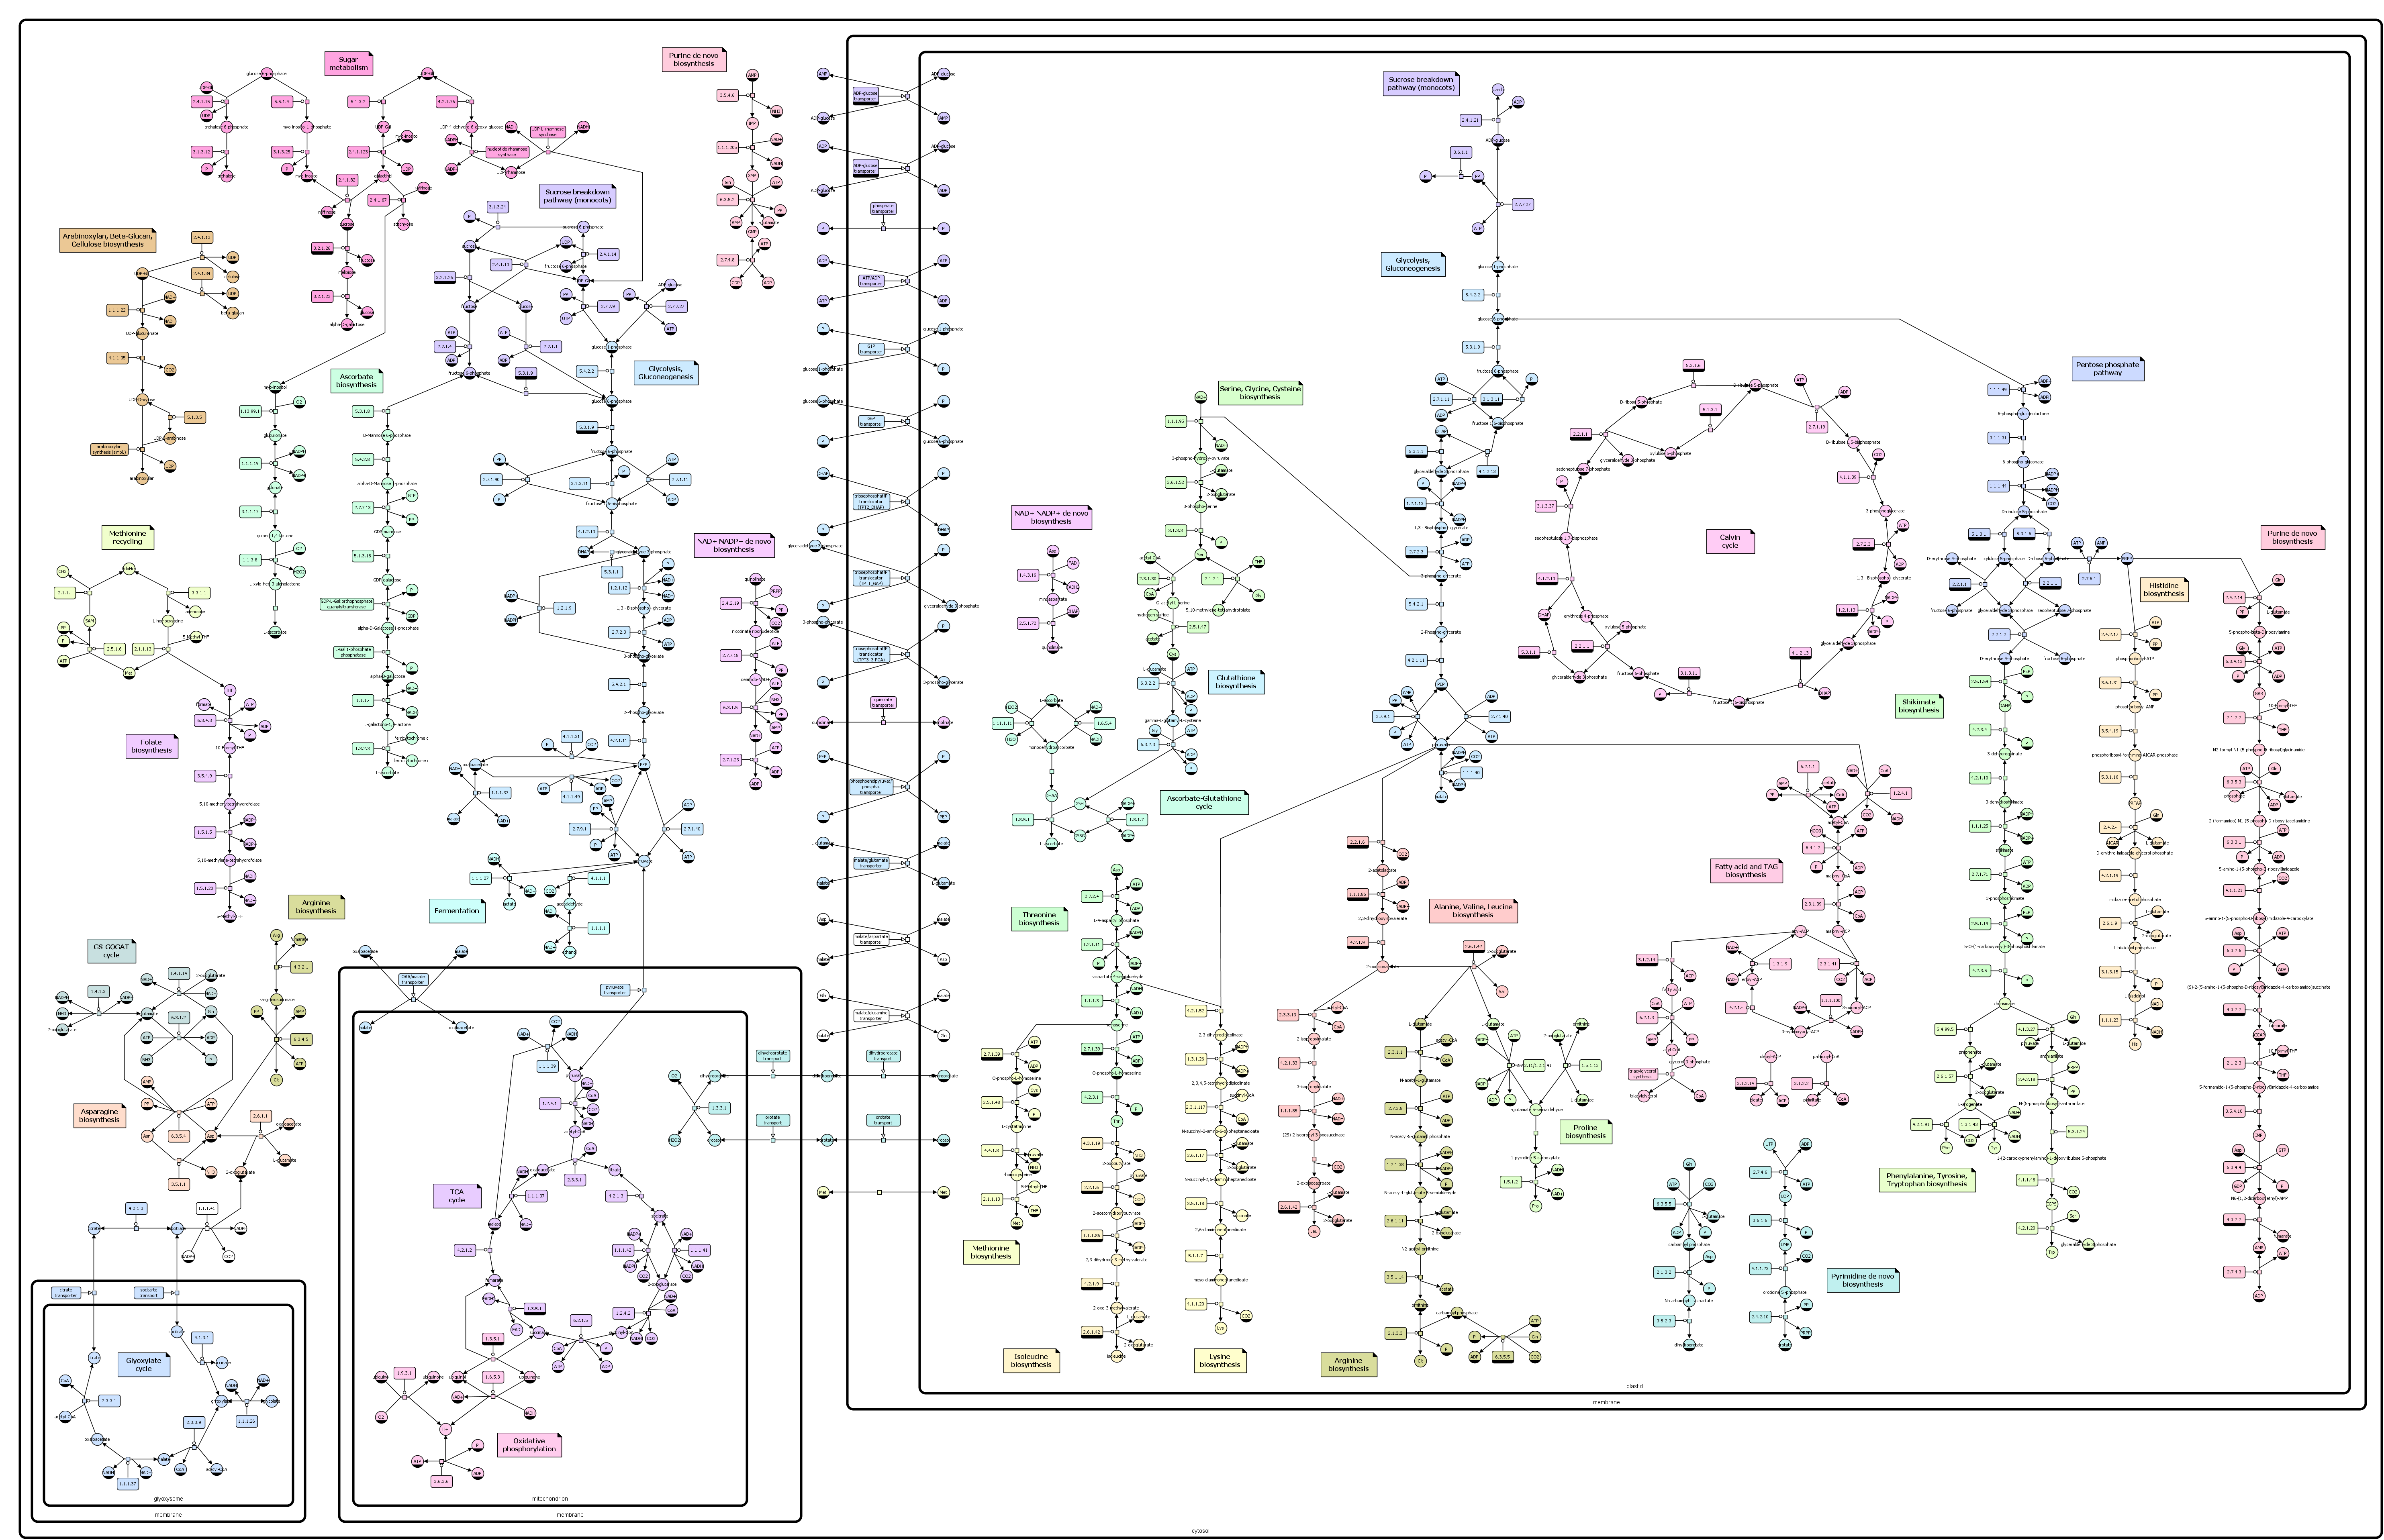
Plant central metabolism
The following map won the annual SBGN competition 2010, section best map.
AF Level 1 examples
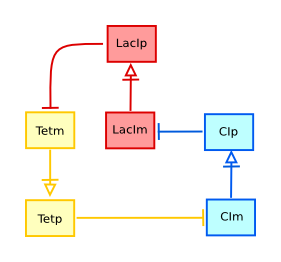
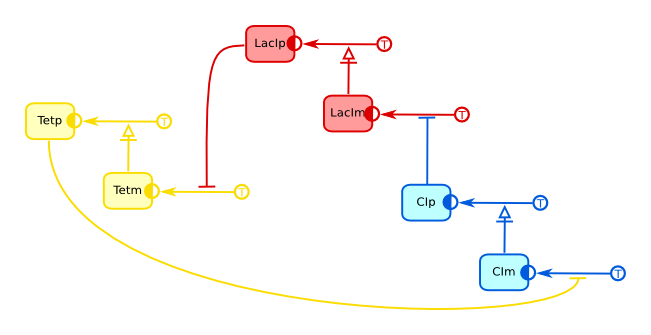
Repressilator (AF)
The repressilator is a circular system of three genes which products sequentially inhibit the expression of the next gene. Both the model and its in vitro realization were published by Michael Elowitz and Stanislas Leibler in 2000, in a publication that is seen as one of the milestones in the birth of Synthetic Biology.
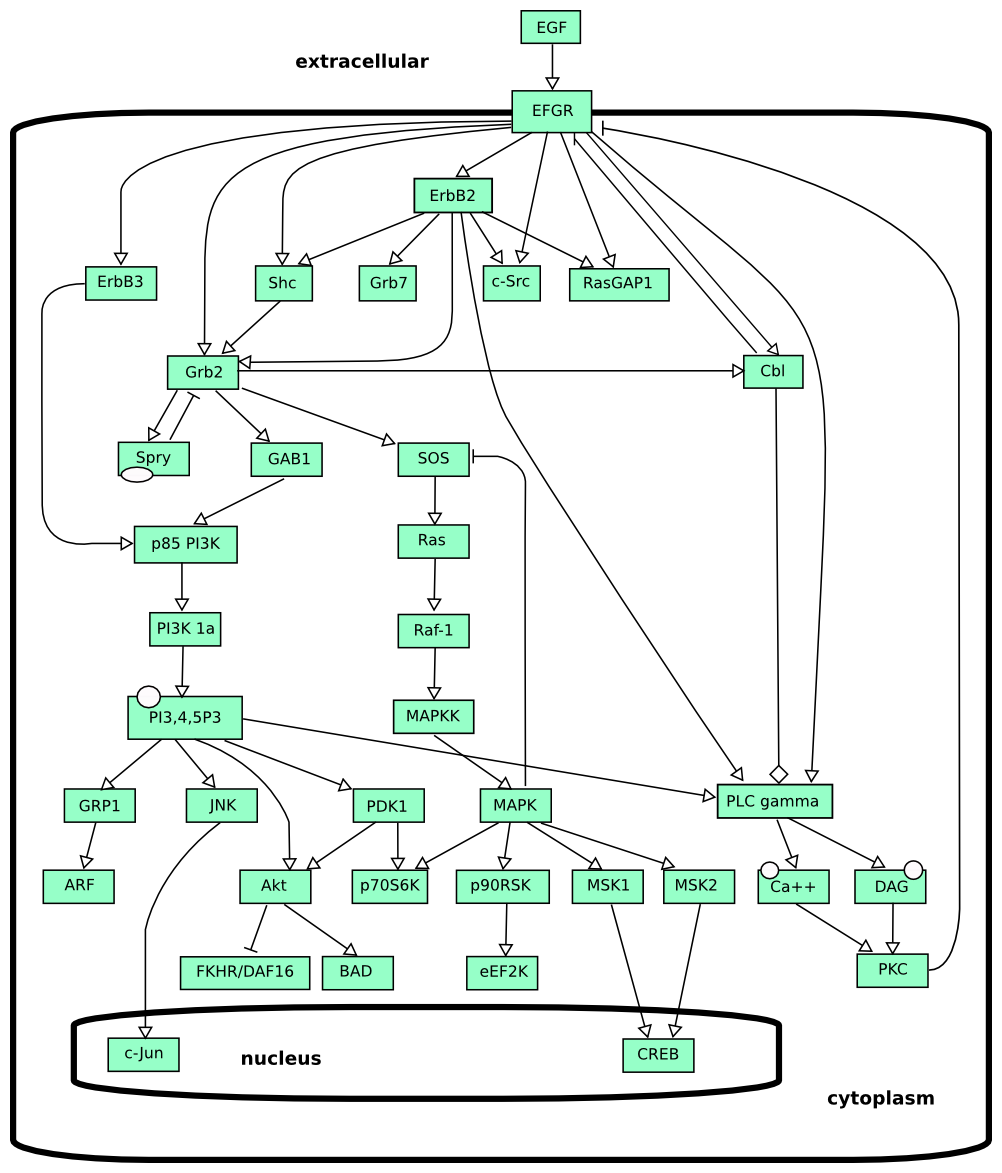
EGFR signalling
This is a representation in AF of the signalling pathways triggered by EGF binding on its receptor. The original information came from STKE, and a first version of the image was published in the initial SBGN publication.
ER Level 1 examples
Autophagy
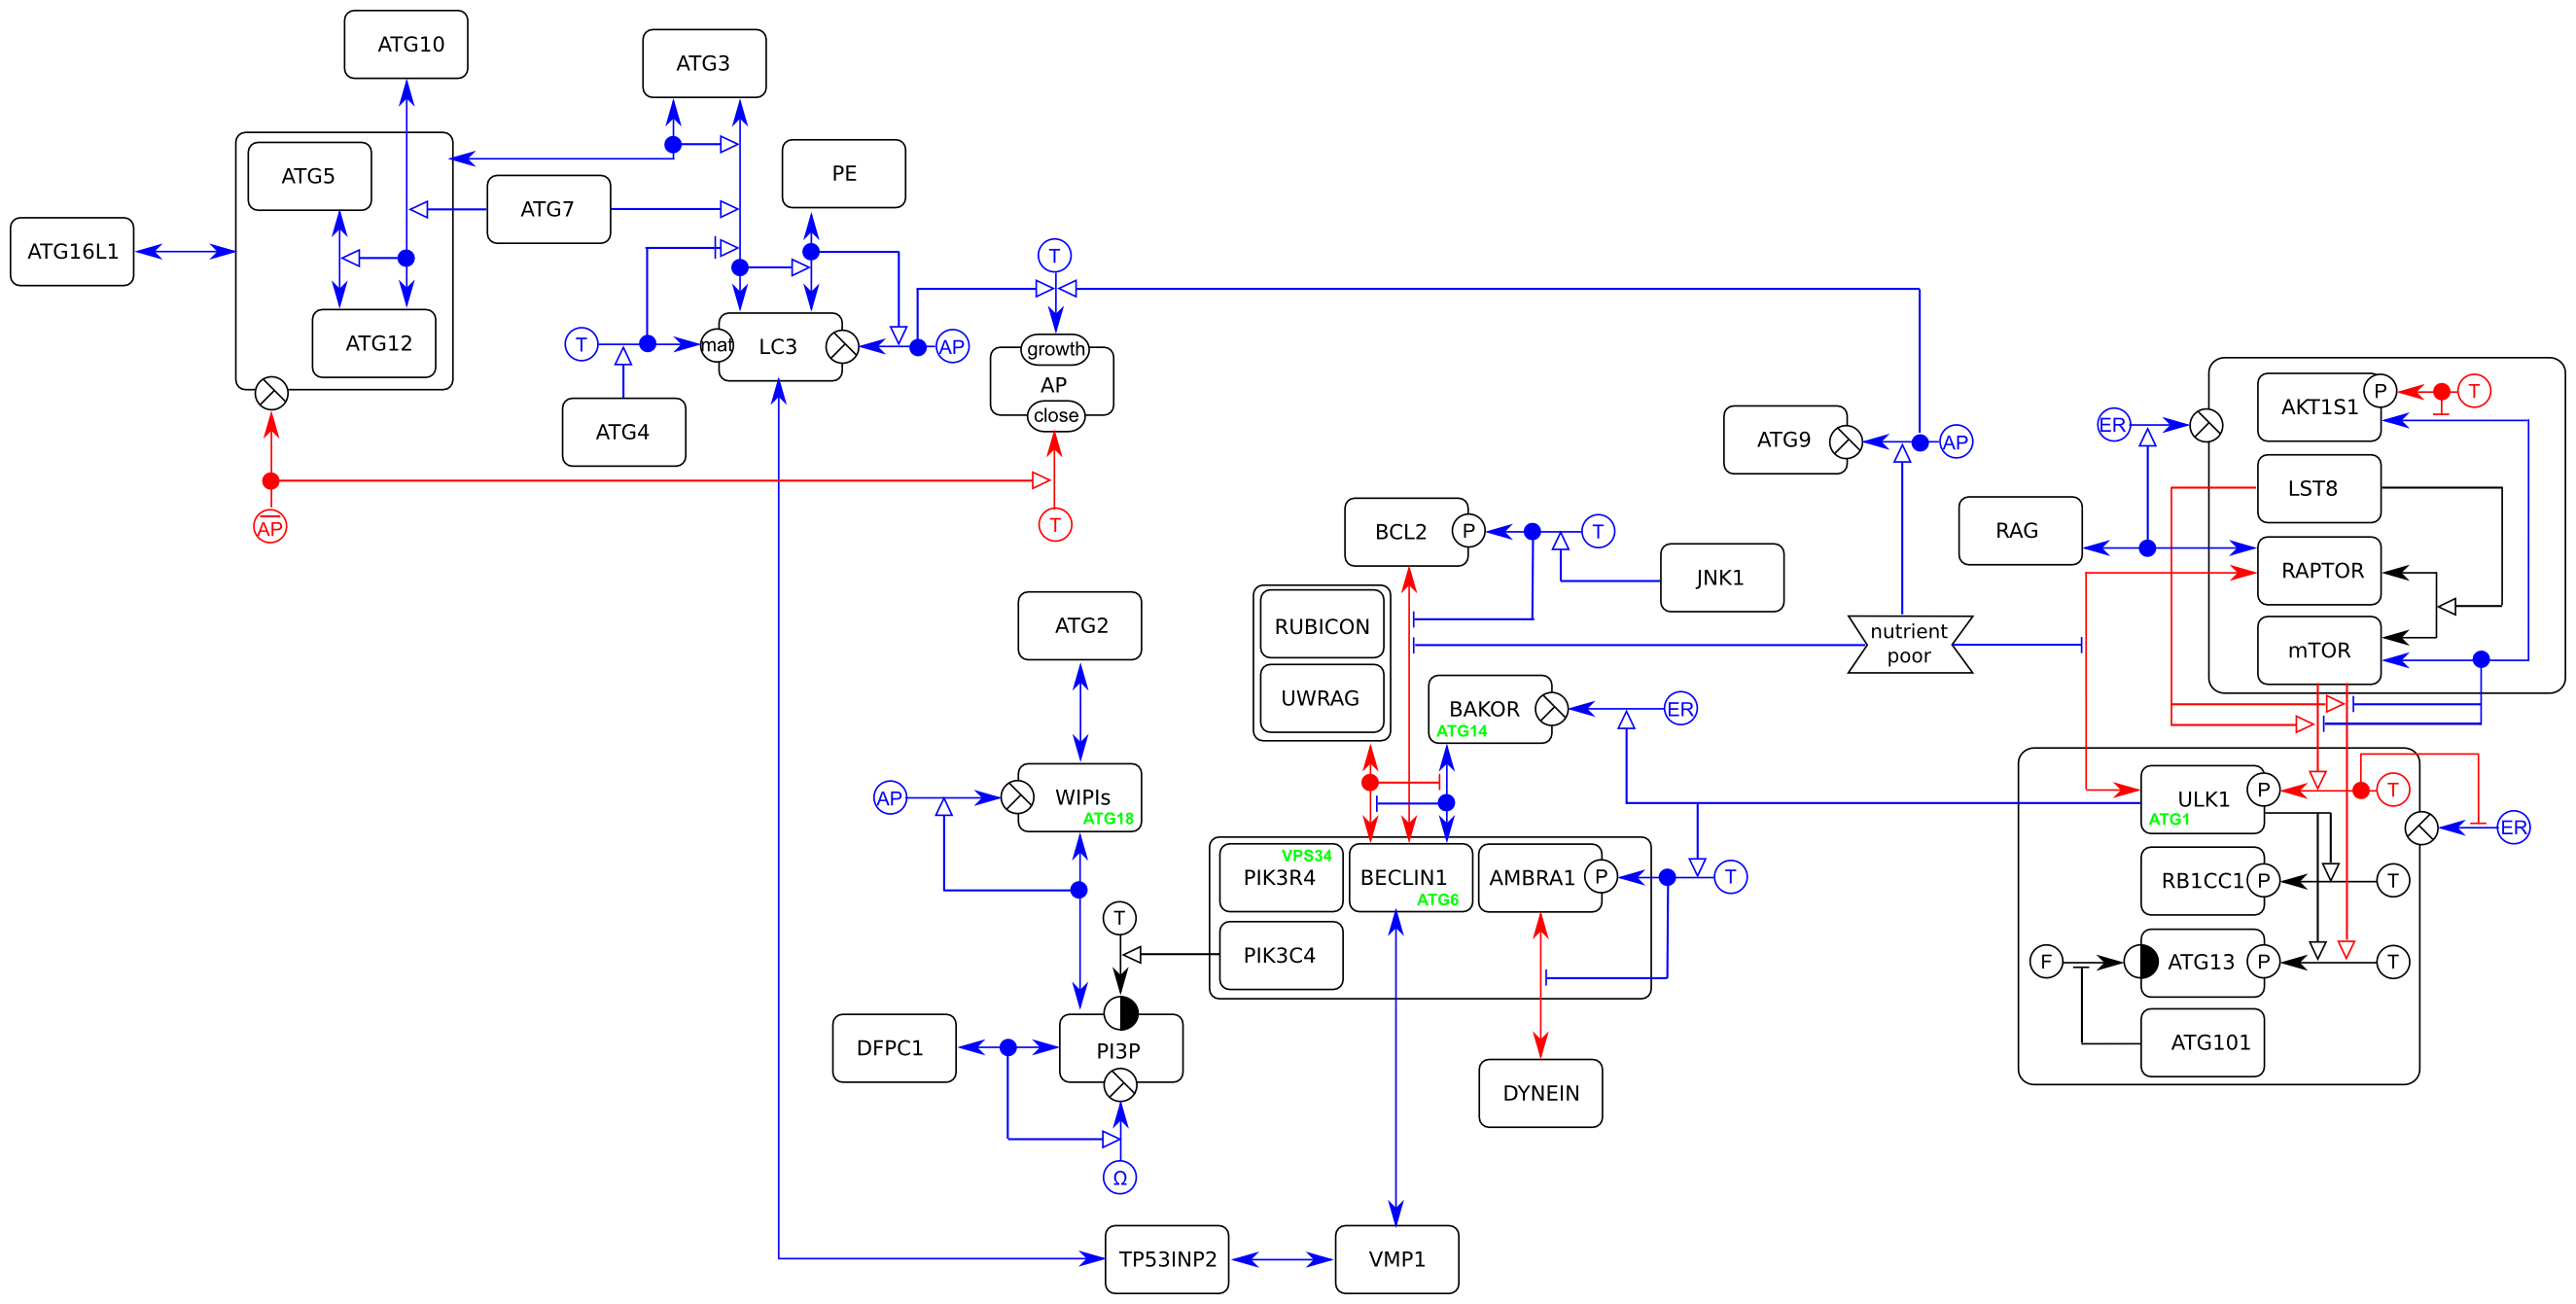
This map describe the molecular events leading to the formation of the autophagosomes, intracellular organelles responsible of autophagy, a mechanism by which a cell produces nutrients from the digestion of its own macromolecules. The map makes use of nested entities introduced in ER L1 V2. Blue influences promote autophagy, red inhibit it (and promote growth).
Polymerase chain reaction (PCR)
This example presents the different relations between the four entities involved in a Polymerase Chain Reaction (PCR). This examplifies the use of the entity, the logical operator or, the state variable existence, the unit of information, as well as the relationships interaction, assignment, necessary stimulation and absolute inhibition.
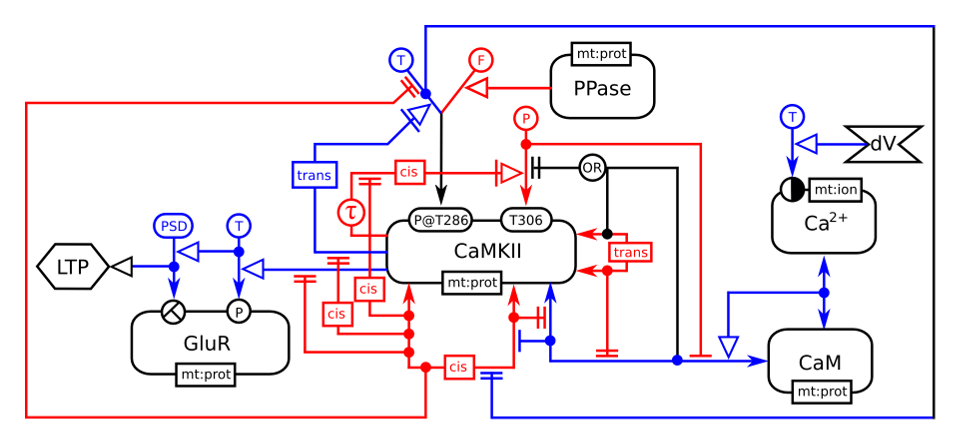
CaMKII in synaptic plasticity
This example depicts the effect of a depolarisation (dV) on the intracellular calcium, that binds to calmodulin, that itself binds to the calcium/calmoduline kinase II (CaMKII). The binding of calmodulin inhibits the folding of CaMKII monomer on itself, thus relieving the inhibition on the kinase activity. The phosphorylation of the glutamate receptors finally leads to the Long Term Potentiation (LTP) of the synapses. In addition, the map shows the effect of trans-phosphorylation on threonine 286, that makes the enzyme constitutively active, and on threonine 306, that renders the kinase insensitive to calmodulin, as well as the dimerisation of the kinase. In blue are the relationships enhancing the synaptic weight and in red the relationships decreasing it.
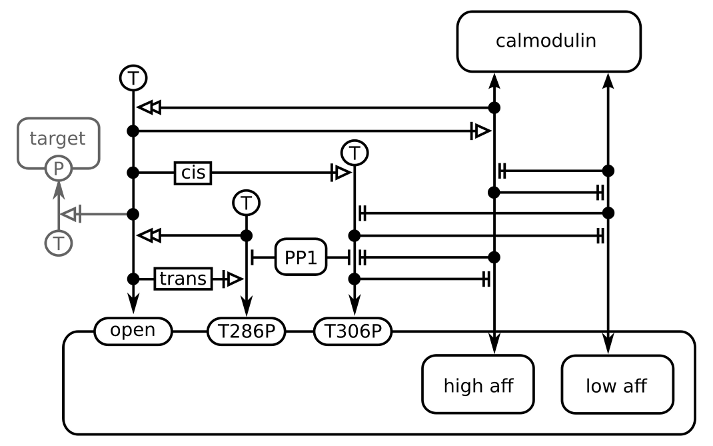
CaMKII in synaptic plasticity (example II)
The image below shows the effect of calmodulin binding on CaMKII activity, using the nested entities of ER L2 V1. The image comes from the publication of Stefan et al (2012).
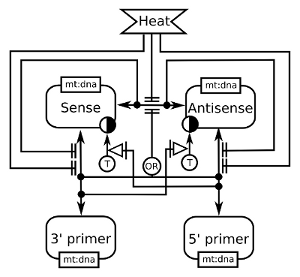
Repressilator (ER)
The repressilator is a circular system of three genes which products sequentially inhibit the expression of the next gene. Both the model and its in vitro realization were published by Michael Elowitz and Stanislas Leibler in 2000, in a publication that is seen as one of the milestones in the birth of Synthetic Biology.
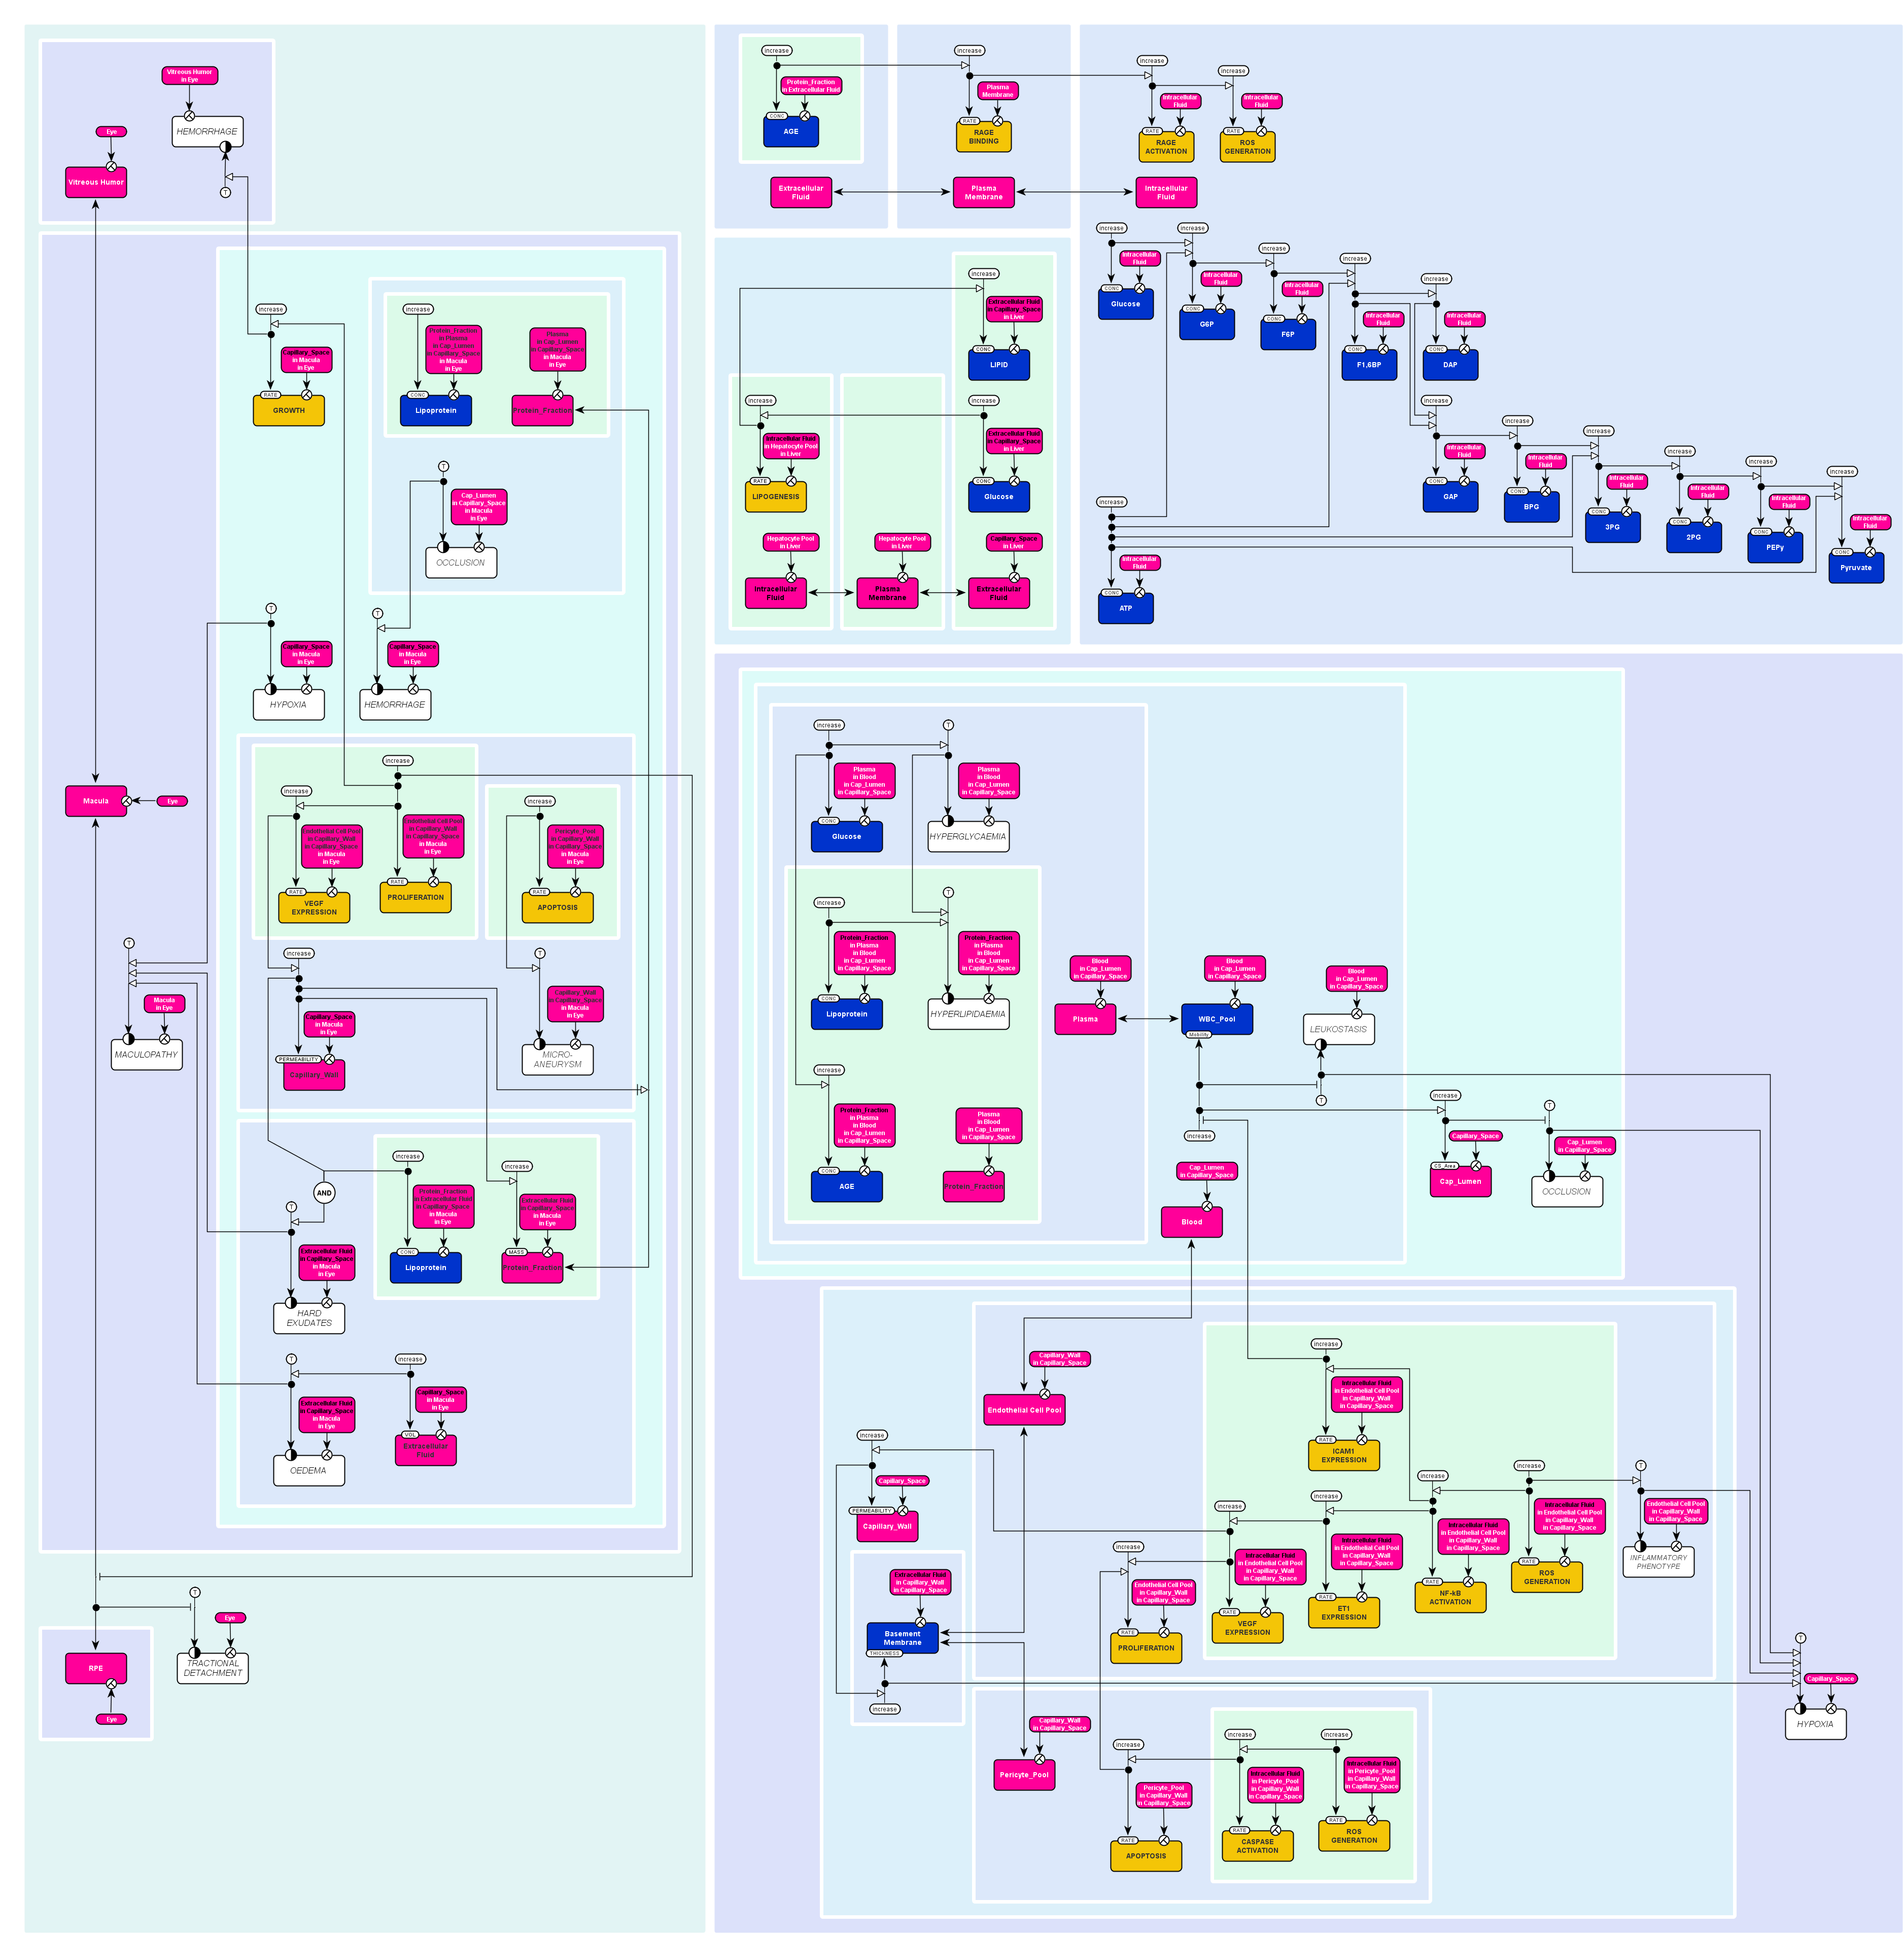
Development of diabetic retinopathy
The following map was presented to the annual SBGN competition 2010, section best map.
Bacterial transcription initiation
Diagram represents steps of transcription initiation in bacteria. As ER does not represent time, diagram has been converted to a movie.
First step of the process is the association of RNA-polymerase with sigma-subunit to form holoenzyme. Holoenzyme is able to interact with promoter DNA. Alpha-subunit of RNA-polymerase is able to interact with up-element of the promoter and sigma-subunit is able to interact with -10 and -35 hexanucleotides of the promoter. Binding of holoenzyme to the promoter facilitate binding between sigma-subunit and promoter and interaction of up-element with RNAP is also facilitate that binding.
Interaction between -10 hexanucleotide and sigma-subunit is required for melting of the promoter DNA and formation of “open” complex. In “open” complex RNA-polymerase is initiate synthesis of RNA product. After synthesis short product in the process of abortive synthesis sigma-subunit leaves RNAP-promoter complex and RNA-polymerase comes to the elongation phase.